Bitcoin is showing signs of recovery after a 6% drop yesterday to below 101,000, which shook investor confidence. On June 6, (BTC) climbed back to around 105,000, bouncing off a major support.
This rebound comes after a tense public argument between Donald Trump and Elon Musk, which resulted in a lot of investors pulling out of the market, as traders holding leveraged crypto positions found themselves being liquidated. According to Coinglass, over $341 million worth of BTC was liquidated in a single day, with over $300 million coming from long positions.
This Conflict added fuel to fears of a deeper price correction as bias in the market began to change from a long to a short position.
An analyst on X pointed out a bearish view of the market while suggesting the market selling to 95K “The BTC breakdown has begun!; Eyeing 95k and possibly lower.; Depends on what happens when we consolidate.; Again HTF has bearish signs all over it!
Another trader, Friedrich, agreed, calling the drop “annoying” and suggesting two possible outcomes: “A retest around 105Ks and bleed toward 87K. Or a reclaim above 105.8K–106K and the journey toward a new ATH begins.”
BTC Market Analysis
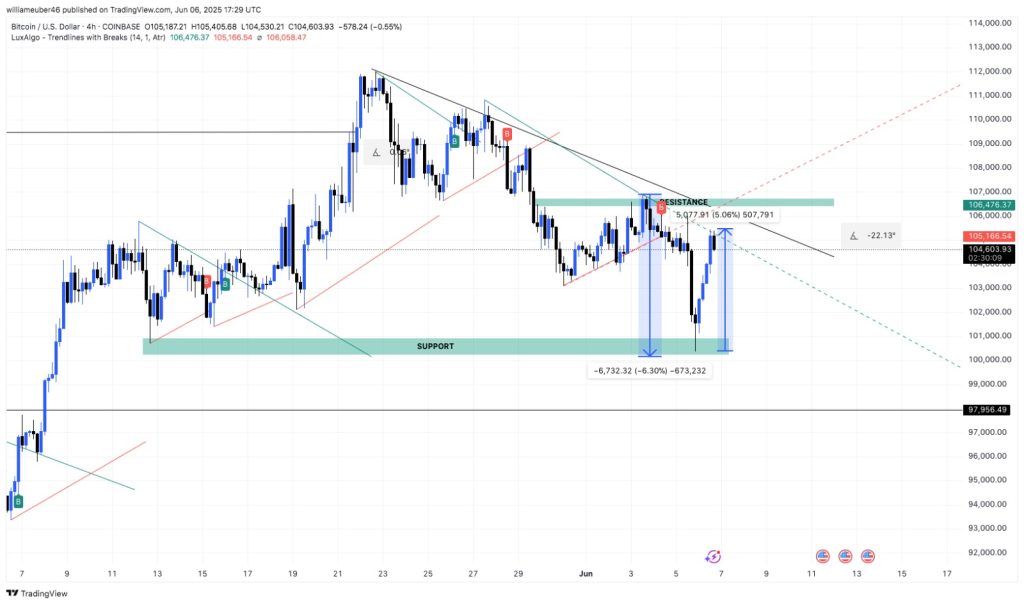
Despite the pressure, Bitcoin found support at $100,386 and began to climb back up. At the time of writing, BTC is up 5.15% sitting at 105,000.
But the real test is still ahead. Looking at the chart on a 4h time frame, a major resistance can be seen at the 106, 476.37 level which happens to be the previous high. If the price breaks past this support level, we might just see the market push higher, creating a new high but if it fails, If it fails, we might see a long consolidation or another sharp drop.
RSI and Bollinger Bands Show Mixed Momentum
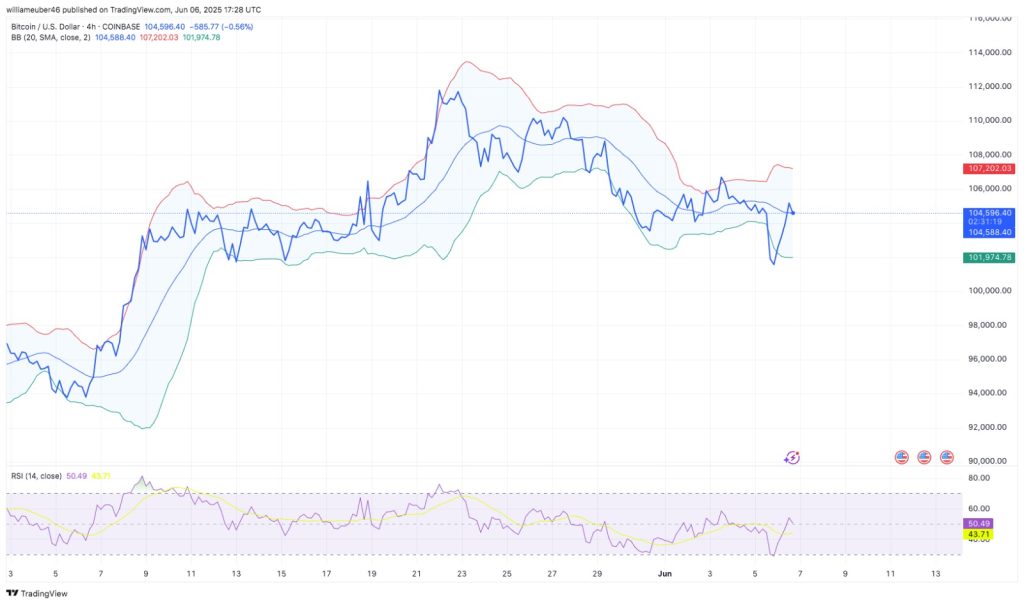
Looking at it through the lens of RSI and Bollinger Bands, the momentum in the Bitcoin market currently paints a mixed picture.
The Relative Strength Index (RSI) has bounced from oversold levels near 25 and is now hovering around 52, just slightly above the neutral 50 mark. This shows while buyers have returned to the market it’s still too weak to confirm a strong uptrend. For a clearer sign of sustained buying power, it’s best to wait for the RSI to climb above 60. Until then, the recovery remains shaky.
Meanwhile, the Bollinger bands also reflect this caution, while the price was recently slightly above the middle band, it has also shown a sign of rejection suggesting a weak buying pressure.
While Bitcoin’s bounce from recent lows shows promise, key resistance and technical signals like RSI and Bollinger Bands suggest caution. The market is yet to confirm a full recovery, and the next few sessions will be critical in deciding if this is just a relief rally or the beginning of a broader bullish reversal.